TwitchView_Logo-BLACK-Lockup_jm-1-1

Continuous Quantitative Monitoring of Neuromuscular Blockade

Three unique TwitchView features enable the precise management and appropriate antagonism of neuromuscular blockade.

1

Validated Accurate Data

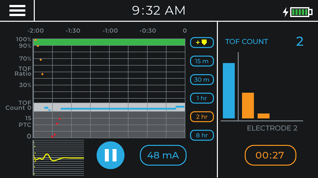
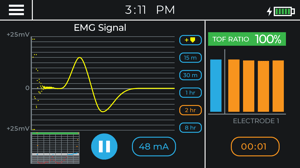
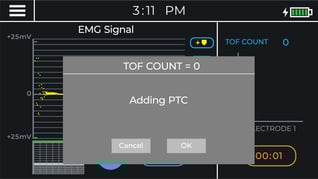
Sensitive detection of twitches from profound blockade via post-tetanic count (PTC), to moderate blockade and recovery via TOF Count and TOF Ratio [1,2].

TwitchView EMG TOFR 100%

2

Automatic Continuous Data

An AutoPTCTM feature that switches automatically between TOF and PTC stimulation modes based on the patient’s real-time level of blockade.

TwitchView Auto-PTC

3

Real-Time & Trended Data

An interactive, dynamic trend plot that enables clinicians to visualize how neuromuscular blocking agents affect each patient differently.

TwitchView Trend Plot TOFC 2

How does TwitchView change practice?

The prevailing mental model of rocuronium as a short acting drug does not apply to all patients. In the scatter plot, each triangle represents one patient. Following a single 0.6 mg/kg intubation dose, over 30% of patients have a TOF ratio < 90% two hours after administration, with some patients taking more than six hours to completely recover [3] .

With TwitchView, clinicians can visualize how neuromuscular blocking agents (NMBAs) differentially affect each patient. Many clinicians begin to use smaller intubating doses (e.g., 25 mg rather than 50 mg of rocuronium) as well as smaller and less frequent maintenance doses. With less overall rocuronium use, patients tend to have shallower blockade at the end of the case, allowing for lower doses of sugammadex, the use of neostigmine instead of sugammadex, or even spontaneous recovery. Importantly, adequacy of reversal is confirmed by a TOF ratio > 90% prior to extubation, which eliminates the possibility of residual neuromuscular blockade and supports conservative reversal choices.

NMBA Recovery Scatterplot

Clinical Examples

The following two clinical cases illustrate a typical evolution in practice when using TwitchView to guide neuromuscular blockade.

Clinical Case #1

An 82 kg patient was given a maintenance dose of 25 mg rocuronium (“1” on trend plot), taking them from a TOF Count 2 to a PTC 2, where they remained for over one hour (the end of the case). With a PTC 3 (“2”), the patient received 4 mg/kg of Sugammadex (328 mg) at a cost of $181. The TOF ratio was > 90% at the time of extubation.

TwitchView Trend Clinical Case 1

TwitchView monitor screen of case #1

Clinical Case #2

Patient received two 10 mg maintenance doses of rocuronium (at “1” and “2”) to bring them to a PTC 8, followed by spontaneous recovery to a TOF Count 3 after 30 minutes. Toward the end of the case, the patient was allowed to spontaneously recover to a TOF ratio 35% (“3”), at which point neostigmine (50 mcg/kg) was administered to reach a TOF Ratio > 90% in approximately 15 minutes at a cost of $11.

TwitchView Trend Clinical Case 2

TwitchView monitor screen of case #2

Leading Hospitals are Already Benefitting from TwitchView.

We understand that new technology adoption requires planning, collaboration and education. Blink DC has created a suite of tools to facilitate success, and we will partner with your institution to ensure an effective TwitchView implementation and ongoing use. Contact us to learn more.

TwitchView_MapView-ORANGE-2560px_jm

About TwitchView

Created at the recommendations of clinician scientists and leading experts on neuromuscular monitoring, TwitchView offers simple, accurate and reliable quantitative monitoring. The world’s only clinically-validated electromyography (EMG) monitor, TwitchView has been proven to impact the management of neuromuscular blockade, optimize drug dosing, and eliminate residual neuromuscular blockade.

Twitchview